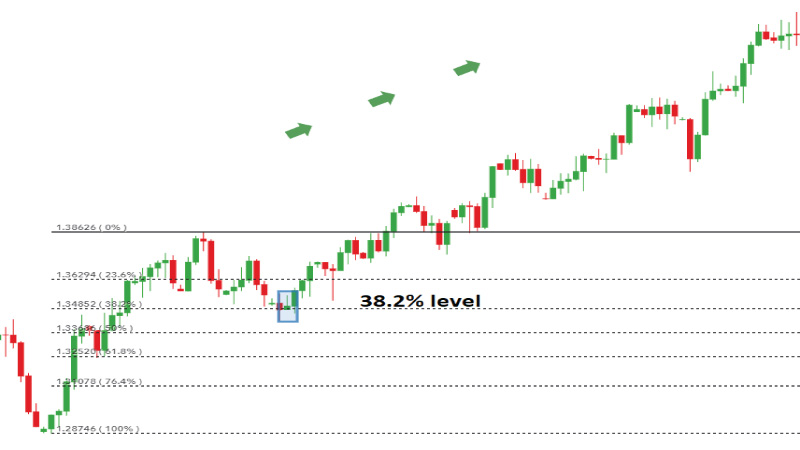
You won’t succeed in the financial markets in the long run if you don’t apply technical analysis. Candlestick patterns are tools used during this analysis. There are different categories of patterns with their specific functions. But today we would like to focus more on Hammer patterns.
Hammer candlestick patterns are helpful for traders in different markets, including cryptocurrencies, stocks, indices, and foreign exchange. Traders use them to spot reversals that often happen after bullish or bearish runs of their assets. It all depends on the asset and the timeframe, however, as a rule, they suggest a bullish reversal at the end of a downside trend. If the trend was moving upwards before, hammer patterns can suggest bearish reversals. When trading, it’s recommended to use these patterns in combination with other tools. This strategy helps to determine potentially profitable entry points for both short and long trading.
As we’ve just mentioned, bullish candles appear when a downside trend comes to an end. Such patterns might be subcategorized into the hammer and inverted hammer. There are also two bearish patterns, and we are going to discuss both categories in this short review. However, before getting started, let’s take a closer look at the concept of the hammer candlestick patterns.
Introduction
Hammer candlestick patterns are quite widely used among the majority of traders, no matter which financial market they prefer to trade on. This is because this exact type allows forecasting the outcomes of current price fluctuations.
This candle won’t bring you gains on its own. If you want to apply it efficiently, you should have some knowledge of fundamental analysis and skills in using more analytical tools and indicators available on your platform.
Such efficiency is possible thanks to the reliability of the hammer candle. Many participants in financial markets believe that it's the most reliable pattern in charting. There is a grain of truth in such a statement. If you want to take advantage of the hammer candle, learn more about its subcategories and their functions in candle charts.
Bullish Patterns
Hammer candlestick
This type of candle appears on the chart when the asset is more expensive at its closing value. This means that more profitable conditions for buyers occur. Before this trading period comes to an end, they will have more control.
Inverted hammer candlestick pattern
An inverted hammer candlestick is the opposite – it happens when the trade might be closed at a higher value than it was opened. When it appears on the chart, it means that there was buying pressure, which should have caused the price to go up but this didn’t happen before the candle closed.
Bearish Hammers
Hanging man candlestick
This is a red candle that is formed when the trade might be closed at a lower value than it could have been opened. According to this candle, the majority of traders tend to sell the asset. Because of this, the downside reversal might occur and cause a downside trend in the asset value.
Shooting star candlestick
This is an inverted pattern that appears in the environment when the majority of traders go bearish. It looks similar to inverted candles but they are formed after upward fluctuations. When they occur, it means that the downside movements are about to start.
The advantages and disadvantages of the hammer candlestick patterns
There are no 100% accurate candlesticks in charting. Even if you have enough skills and knowledge to conduct perfect technical analysis, financial markets might be too unpredictable. No one can guarantee you that your good technical analysis will bring nice profits. To be efficient, the hammer candlestick patterns should be used in combination with other tools.
Advantages:
- They are useful when you need to detect trend reversals, no matter which financial market you prefer.
- Hammer candlesticks are available in various timeframes, which give you a good opportunity to benefit from both swing and day trading strategies.
Disadvantages:
- Hammer candlestick patterns indicate reversals but the context might be very different from the trend on the chart, not all spotted reversals are correct.
- Hammer candlestick patterns will not bring you many benefits if you do not apply other instruments of technical trading.
Final word
In the end, we would like to highlight this again: learn how to use other technical tools in order to be able to benefit from the use of the hammer candlestick patterns. It’s never too late to try some new technical indicators or strategies that might appear to be more helpful in the long run.
You should also keep in mind that trading always involves risk, and even the best candlesticks patterns might not spot the reversals correctly all the time. Consider the volatility of your asset and your financial market and try to apply special instruments that will help to decrease potential losses.